How data visualization is used to help businesses
Data is a powerful tool capable of driving results-driven efforts and using the information to attain a competitive advantage. However, data on its own can be overwhelming for even the most technical of users, which is where data visualization comes into play.
With data visualization, teams can see beyond specific data points, understanding large volumes of data within the business environment. Set up properly, teams can further recognize patterns in their industry and use these insights as a baseline for decision making.
Analyzing Business Benefits
Since tools to create a data visualization map come at a price, businesses must justify their use. Therefore, in application, some of the most common benefits include:
Trend Identification
Among the most known benefits of data visualization is the ability to spot trends. By formatting data visually, users can see patterns in the way events occur. With patterns come predictions about product sales, demand, and other relevant indicators. These predictions become more accurate since they have a foundation in past and present data.
With trend identification, users gain everything they need to know about their standing within the industry and the company-wide goals they wish to achieve in the future.
Accelerated Action
Leaders must make critical decisions daily, some of which may greatly impact the company’s profitability for the quarter. On the other side, analysts routinely interact with large volumes of raw data. Proper data visualization becomes the bridge between decision-making and data points, informing the direction of the business.
Written data points are hard to interpret at an initial glance. Therefore, data displayed visually makes it easier for leadership to glean the most valuable insights from complex datasets. These tools easily surface relationships and bring the transparency necessary for decision-makers to take meaningful action at an accelerated pace.
Reinforces a Message in the Minds of Business Users
Since visual information makes information easier to understand, it is often more impactful than numbers in a spreadsheet. Therefore, when put into a presentation, audiences, even those of less technical background, can understand and get on board with your visualization’s underlying message.
That said, improper use of visualizations can have the opposite effect. In these cases, rather than driving your point home, they may confuse or overwhelm the viewer.
Improve the Internal Decision Analysis Process
Business leaders should never make decisions on instinct alone. Instead, even though some judgment is needed, business leaders should use a foundation of comprehensive analysis. When analysts present their findings with visual tools that display data without bias, leaders can make decisions that can confidently ensure the best outcome for the organization.
However, the key to improved decision analysis is the removal of bias. Teams must then ensure that their bias isn’t being transferred over in visualizations, and they are also taking the time to update charts and visuals as new findings become apparent.
Bring Better Products to Market
Especially in highly competitive markets such as retail, entertainment, and technology, the race is to bring better products to the market quickly. The reality is that gaining this first-mover advantage relies on a company’s ability to respond to customer problems, including collecting and analyzing market feedback and gaining insights into competitor offerings.
Therefore, enacting data visualization benefits teams in translating data points into market solutions before their competitors.
Pinpoint Errors and Risks
Monitoring the performance of tools and machinery can help teams detect errors. Consider that pinpointing this data can ensure that malfunctions and the following events won’t occur. With the proper setup, decision-makers can also use visualizations to identify threats in their processes and take preventative measures accordingly.
Inform Stakeholders With Need-to-Know Details
Data visualization offers the inherent ability to process large amounts of information quickly. On that account, users can get an in-depth and accurate look at insights on all relevant avenues without finding themselves too much in the weeds.
Since key stakeholders often don’t have the time to look at these details, data visualization becomes largely valuable to get these same ones up-to-date on the key performance indicators (KPIs) they need to act. As a result, many attribute data visualization to being one of the key tools for bridging departments within an organization.
Enable Higher Productivity in Teams
When teams have proper data visualization dashboards in place, the outcomes, according to experts, are transformative. Consider that when teams spend less time analyzing data and more time strategizing, individual members are more productive. Then, rather than being bogged down creating complex reports, they can quickly repopulate existing visualizations with new details and make better decisions on the fly.
The Types of Data Visualization
Data visualization can take many forms. However, some of the most common include an area chart, bar chart, bubble cloud, cartogram, dot distribution map, Gantt chart, heat chart, and histogram. Finding the right visualization tool often holds significant weight since the wrong tool is comparable in impact to no tool.
Therefore, teams often use modern tools to help integrate analytics and visualization practices into their process. These tools enable faster sorting, organizing, storage, and creating graphical representations to make comparisons to find the best fit for the story teams want to sell.
We can summarize the proper use of each as follows:
Charts
As mentioned in the previous paragraph, charts come in several formats, which is part of their appeal. However, charts as a data visualization type are most effective when indicating a relationship between element Y over some time. Alternatively, many find charts effective in demonstrating something in proportion to a whole.
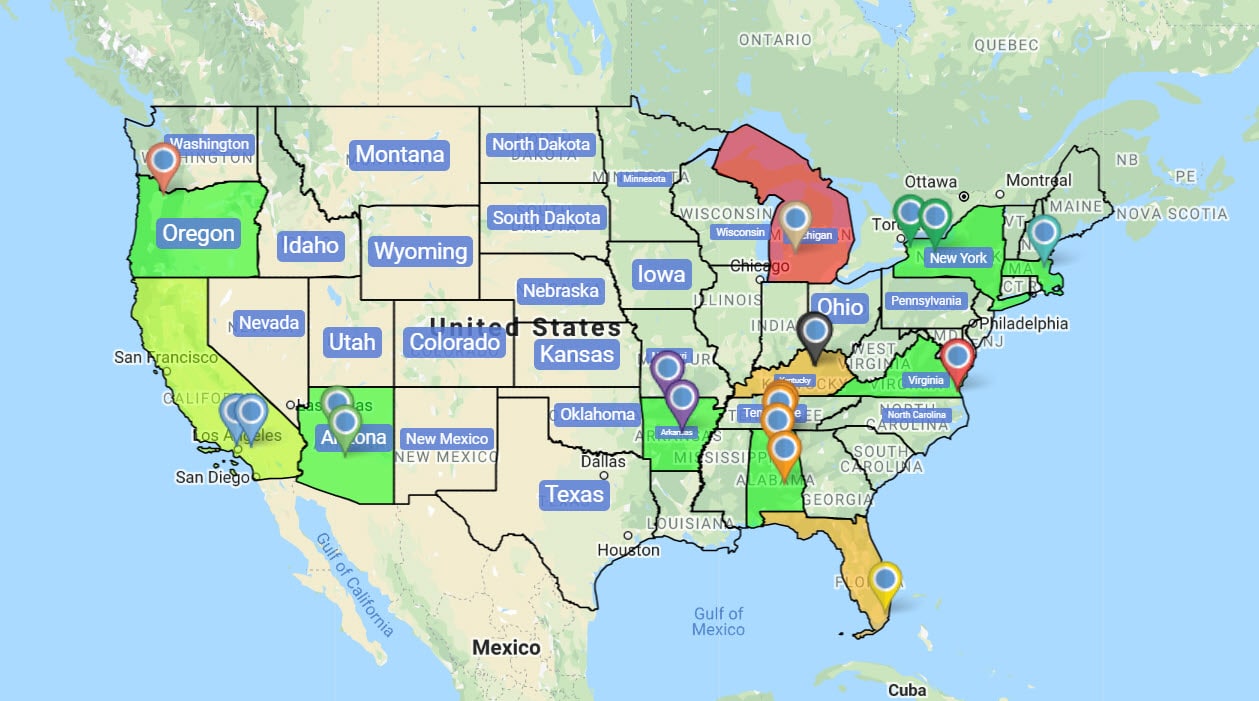
Maps
Maps often accompany charts as a method of locating elements within an area. They are often displayed as a part of a website proposal, geographical map or another building plan. Users will still come across several types within the map category, including cartograms for visualizations indicating themes.
Plots
Next on the list are plots. Plots show the relationships in a given set of data using a set parameter. Some of the most common examples include bubble or scatter plots, which are common in large volumes of data.
Matrices
Matrices, also referred to as diagrams, are often employed to show relationships between data and links. A matrix then uses a single data representation to showcase multidimensional or hierarchical relationships.
Summary
One truth becomes clear after reviewing the many benefits of data visualization. That is, data visualization isn’t just charts. It uses data to tell a story that can compel people, change perspectives and inspire entire audiences to action.